
If you have developed a mobile app and it’s already live on Google Play and App Store, and you’re promoting it actively, you should now focus on tracking the most important mobile app performance KPIs.
Most marketers place a high priority on application performance measures. Monitoring your app’s performance is critical as marketers employ mobile analytics to improve mobile app usage and performance.
However, if you don’t track KPIs, you won’t be able to make effective decisions for your mobile applications, which may lead to app failure. And honestly, No one wants a fallout when all that is required is examining vital data for mobile apps.
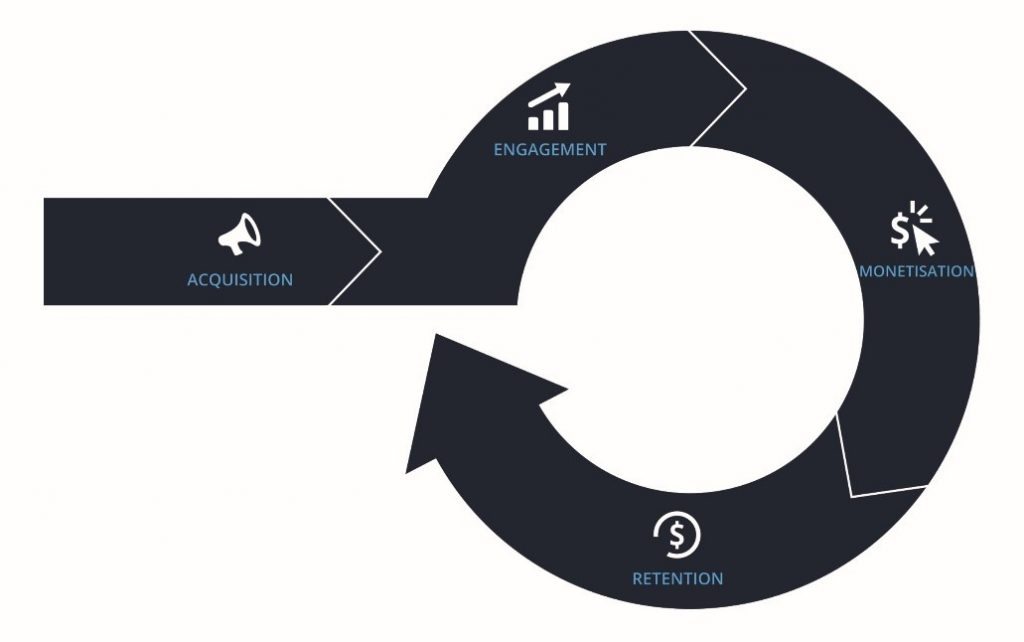
To ensure that your user acquisition campaign operates as expected, you must track various metrics, including acquisitions, engagement, activations, reachability, uninstalls, etc. However, in addition to the essentials, consider the following mobile-specific KPIs to help speed up the success of your mobile app.
To achieve your ultimate objectives, you must first decide on the set of KPIs that you want to track. Key performance indicators and measurements are used to assess app performance, and you can only do so if you know what you want to achieve. These variables are required to estimate and measure prospective success rates.
Below is a list of critical mobile app performance KPIs for any app. These metrics indicate how well an app functions, how appealing it is, and how much revenue it generates. Similarly, these KPIs boost your knowledge of your target audience and assist you in developing the app’s business success.
Your retention rate indicates the number of users who continue using your mobile app post-installation. In essence, the higher your retention rate, the higher your individual consumer value.
Various milestones might have different meanings based on your industry, but measuring retention can provide valuable insights into your business’s viability.
You may try to increase your retention rate after you have a fundamental grasp of it. Think about changing your content to address customer demands better, A/B testing your application, and paying special attention to the onboarding experience after someone installs your app for the first time.
The formula for retention rate:
Retention rate = number of monthly active users/number of monthly installs

Every consumer is valuable, but how can you determine how beneficial they are?
Customer lifetime value tells you how much each user contributes to your bottom line over the length of their smartphone app consumption, including in-app transactions, in-app ads, and subscriptions.
CLV can assist you in determining whether you are investing too much (or too little) in marketing. For instance, the cost of acquiring each user is not balanced by app transactions and services.
It may also help you properly segment and tailor your marketing tactics in order to boost ROI by catering to prospects with greater CLV.
The formula for customer lifetime value:
CLV = (average purchasing size) x (amount of purchases) x (transaction time frame)

For example, You might want to know not only how frequently people sign in but also the duration of their visits.
The formula for the average session length:
ASL = (total session duration of the user) / (number of launches during session)
Most app advertisers may go further, segmenting based on demographic data such as device kind, among other user criteria.
A short session length might suggest an issue and a high drop rate. Suppose you have many people logging in but don’t remain long enough to benefit your business. In that case, this may indicate an issue with the user experience (for example, a bad user onboarding process). Use such data to improve app features and services in the future, which will result in higher ROI.
According to the Adjust study, the average session duration in Q1 2022 was 19.1 minutes.

Many users will fall midway between total churn and dedicated usage. They will vary in frequency—some could be everyday users, while others may sign in occasionally.
Tracking data for each of these people may give your company important and diverse insights. How does your smartphone app meet the demands of different customer profiles?
Additionally, how your app ranks in different app stores can significantly influence user behavior. To understand more about how ranking varies between platforms, check out our article on Ranking Factors in ASO: Differences Between the App Store and Google Play.
Establish your own Daily Active User (DAU) or Monthly Active User (MAU) mobile app performance KPIs, as they will differ from one company to another. Once you’ve decided how your business identifies these distinct types of active users, you may experiment with various data frequencies and ranges.
Ultimately, DAU and MAU can help you anticipate your success and business. If you have an increasing number of engaged and devoted users who interact and check in at many touchpoints during the day, your company is on the right path.

Cost per action (CPA) calculates the cost associated with a user taking a conversion-driven action, like making a transaction or signing up.. Assume you had an effective $10,000 ad campaign that resulted in 500 conversions.
The formula for cost per action:
$10,000 / 500 = $20
CPA offers a vital business viewpoint that may assist you in evaluating the effectiveness of your campaign. Nevertheless, the great majority of marketers ignore cost optimization in favor of sales acquisition and traffic.
By minimizing costs and lowering the cost per acquisition, you may significantly boost your return on investment (ROI) in a short amount of time.

Tracking your mobile app conversion rate is as critical as tracking your blog conversion rate. How else will you understand the specific advantage of this option? It is entirely up to you how you monitor conversion—some may want to analyze installations, while others may prefer sales, for instance.
Ultimately, the goal is to thoroughly understand how clients use and engage with your mobile app.
Your company’s conversion rate will be determined by your business model’s distinct conversion goals—there is no standard “ideal” figure.
Nevertheless, this mobile measurement may give important UX insights and pinpoint conversion events in the sales life cycle. Monitor conversion rates to get access to new touchpoints along the client journey.
The formula for conversion rate:
Conversion rate = number of users who did an action/number of users who could have done the action

Cost per install (CPI) measures how much you pay to gain users when they view an ad for your app.
The approach places a greater focus on tracking purchased installs than organic ones. As an outcome, CPI can assist you in determining if your paid ads are profitable and sustainable.
The formula for CPI:
CPI = Complete ad spend / total installs
Churn refers to users who quit using your mobile app. Certain people remove entirely (uninstall) the app, while others just do not log in. Nonetheless, this rate is a crucial measure of app success and any adjustments that may be required.
The churn rate is also directly related to your company’s bottom line—the more your acquisition expenses, the greater your churn rate. In-app event tracking may assist in determining when churn begins, delivering vital info about your user journey.
The formula for churn rate:
Churn rate = 1 – (amount of active monthly users/amount of monthly installs)
The percent change in users over a certain time period is referred to as the user growth rate. The measure reflects whether the pace of growth is constant, quick, or slow. Studying this app KPI allows you to investigate options such as marketing efforts or pricing campaigns.

Return on investment (ROI) evaluates the revenue earned relative to the cost spent on marketing or other initiatives. Tracking ROI is vital to your app’s growth path, regardless of sector, because ROI offers a solid idea of the app’s performance and economic potential.
The ROI is favorable when your acquisition and marketing expenses are less than the app’s profits.
The formula for return on investment:
ROI = (gain from the investment – price of investment) / investment cost

The time it takes for your app to launch plays a significant role in user satisfaction. A snappy response can set the tone for the entire user experience.
App Load Time quantifies the seconds between the user initiating the app and its readiness for user interaction. If users are made to wait, they might perceive the app as laggy, leading to reduced engagement or even abandonment.
Keeping an eye on this metric will allow you to identify potential bottlenecks in the app’s loading process. Addressing these can drastically improve the user’s first impression of your application.

Monetization is a pivotal metric for apps that bank on in-app purchases. The In-app Purchase Rate allows businesses to understand the efficiency of their monetization strategies, indicating the percentage of active users spending money within the app.
Regularly analyzing this KPI can help adjust in-app marketing strategies or tweak pricing models for better profitability.
The formula for in-app purchase rate:
In-app Purchase Rate = (Number of users who made an in-app purchase / Total active users) x 100

User navigation patterns provide valuable insights into app usability. The Screen Flow Visualization metric charts out the path taken by users, showing which screens they visit most and where they typically exit.
Recognizing popular routes and potential drop-off points can help optimize user flow, leading to higher engagement.

User reviews and ratings serve as direct feedback from your user base. A high average rating can boost app store visibility and increase organic downloads. Regularly monitoring feedback helps identify areas of improvement and understand what features or aspects users appreciate the most.
The formula for average rating:
Average Rating = Total star rating / Number of reviews

The NPS measures loyalty and satisfaction. By asking users about their likelihood of recommending the app, businesses can understand overall user sentiment. A high NPS suggests strong user satisfaction, while a low score might indicate underlying issues needing attention.
The formula for NPS:
NPS = % of promoters – % of detractors
To achieve your sales goals, you need to know your starting point. Mobile applications put you in touch with an entirely new set of customers, but just like any other channel, you must evaluate the data you gather.
Tracking mobile app performance KPIs like the ones described above is crucial for understanding your mobile app’s overall performance. Moreover, while these KPIs give you insight into app usage and performance, it’s also essential to understand how users discover and download your app in the first place.
Do you want to know more about which KPIs you should be tracking? Or what are the best approaches to grow your app swiftly? Get in touch with our team of experts to get the most out of your app marketing activities.
Originally published on March 13, 2023. Updated on September 4, 2023.
App mobile KPIs (key performance indicators) track the success of a mobile app across time, beginning with its creation and progressing to the revenue generated by the finished product.
Here are some metrics to keep in mind when you track your app’s growth: number of downloads, active users, session intervals, average usage time, churn rates, app ranking in both stores, conversion rate, and more.
Use specific KPIs like CLV, Average Session Duration, and Monthly Active Users, along with tracking tools to assess app performance.
KPIs are specific metrics used to evaluate the effectiveness and success of a mobile app in areas such as user engagement, financial returns, and user retention.
Yes, app downloads measure the app’s reach and initial user interest.